Table of Contents
Kiosks, Digital Signage & Unattended Retail Metrics by Kiosk Association
Self-service technology has moved far beyond simple ticketing or check-in. In 2025–2026, the strongest growth is coming from multi-modal automation ecosystems — kiosks, digital signage, vending, AI-driven POS, smart lockers, and cloud analytics. Across The Industry Group network, we consistently see a blend of labor efficiency, higher throughput, and better customer experience driving adoption.
Below is our 2025 report on the top-performing verticals, why they’re surging, and where OEMs, integrators, and operators should focus for the highest return. We look at self-service overall including service factors. We do not include ATMs or hybrid checkout as “kiosks”.
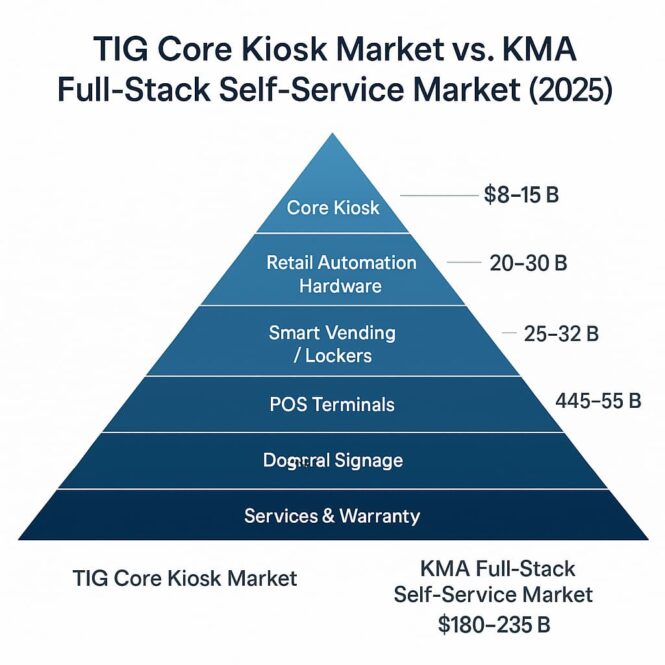
Our estimate is 180-250 Billion, total.
Notes:
- The TIG core kiosk market sits at $8–15B — a clean number that reflects true, interactive kiosks only.
- The KMA full-stack market (digital signage, POS, lockers, vending, AI, and service) lands at $180–235B.
- These are not contradictory estimates — they represent different scopes.
- Kiosks are the nucleus, but the broader self-service automation ecosystem is now 12–15× larger.
- Analysts get wildly inflated numbers when they blur these boundaries.
Top Verticals Overview (2025–2026)
1. QSR & Fast Casual Restaurants
Demand for kiosks, menu boards, AI-ordering, and pickup lockers continues to outpace all other sectors. Upsell automation alone drives some of the fastest ROI.
2. Grocery & Retail
Shrink reduction, returns automation, and BOPIS/locker fulfillment dominate the investment cycle.
3. Healthcare & Patient Intake
Staffing gaps + regulatory pressure = explosive growth for check-in, ID verification, and wayfinding kiosks. Healthcare is huge for EV charging stations.
4. Hospitality & Travel
Airlines, hotels, and attractions aim for higher throughput and fast smooth “memorable” guest journeys.
5. Amusement, Attractions & Entertainment
IAAPA’s strongest segment: ticketing, photo capture, F&B kiosks, digital signage, and smart lockers.
| Vertical | Key Use Cases | Primary Tech | ROI Strength |
|---|---|---|---|
| QSR & Fast Casual | Self-ordering, menu boards, pickup lockers | Kiosks, AI ordering, POS, digital signage | ★★★★★ |
| Grocery & Retail | SCO, returns, BOPIS lockers, endless aisle | Kiosks, lockers, signage, vision systems | ★★★★★ |
| Healthcare | Patient check-in, ID verify, wayfinding | Kiosks, secure payments, signage, queueing | ★★★★☆ |
| Hospitality & Travel | Hotel check-in, ticketing, bag tag | Kiosks, signage, POS, credentialing | ★★★★☆ |
| Amusement & Attractions | Ticketing, photo, F&B, lockers | Kiosks, digital signage, RFID lockers | ★★★★☆ |
| Gaming & Casinos | TITO, loyalty, sports betting, cage automation | Secure kiosks, AML/KYC, signage | ★★★★★ |
| Transportation & Smart City | EV/parking, transit ticketing, permits | Kiosks, chargers, signage, payments | ★★★☆☆ |
| Parcel & Last-Mile Logistics | Returns, package pickup, refrigerated lockers | Smart lockers, kiosks, RFID | ★★★★☆ |
| Financial Services | ATM, bill pay, cash-to-card | Kiosks, POS terminals, ID verify | ★★★☆☆ |
So what about kiosk market share and growth?
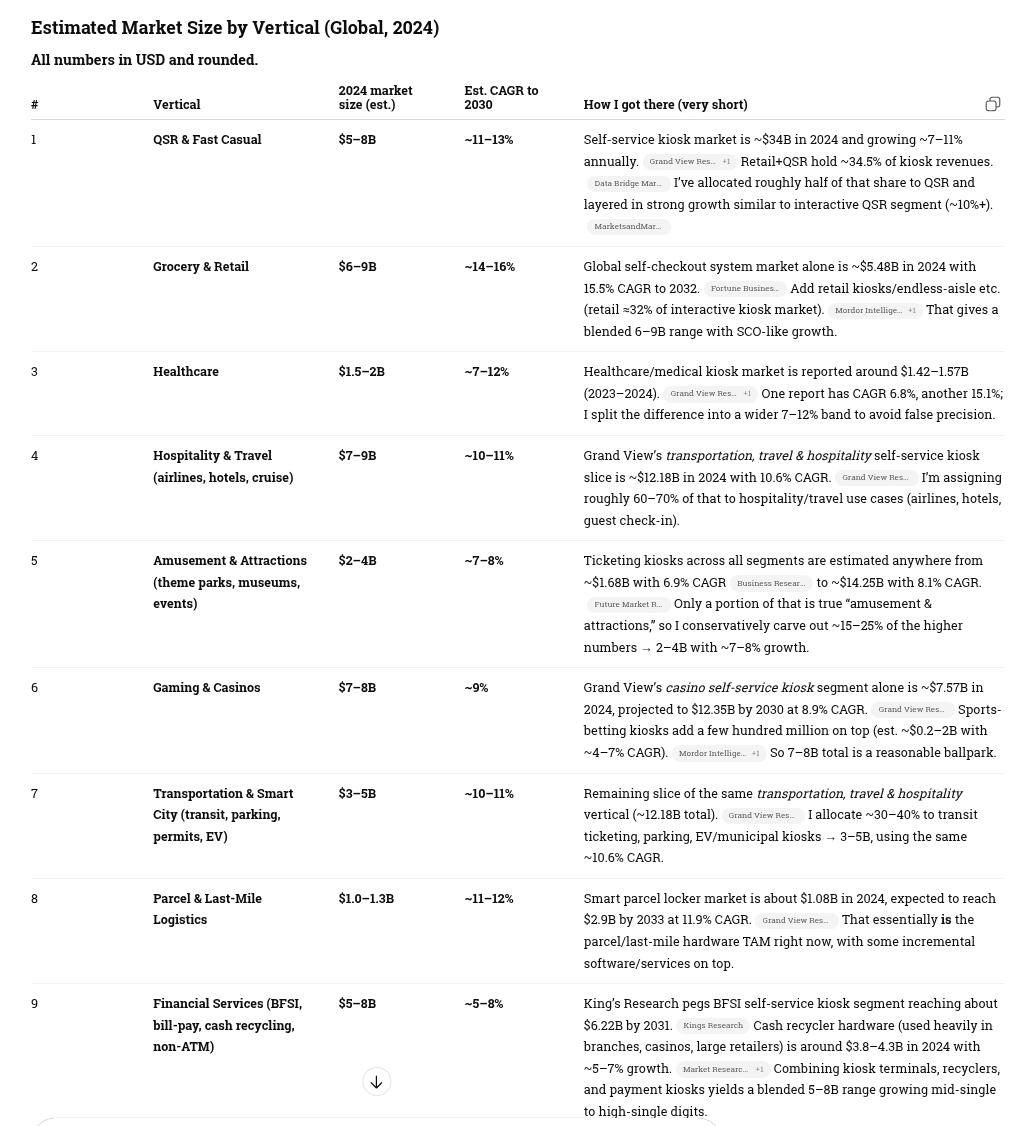
Click for full size — kiosk market share by vertical with growth
Ok — What About Self-Service Overall? Let the Big Dog Eat!
If we naïvely add the midpoints we get ≈$210B global spend in 2024 across the stack. That overstates true TAM because:
-
POS is used in many non–self-service scenarios.
-
Kiosks and vending often embed POS and sometimes digital signage displays.
-
Conversational AI runs both on self-service endpoints and on contact-centre / web channels.
The global self-service technology stack—kiosks, POS, digital signage, smart vending, and conversational AI—sits in the $150–200B range today, with blended high-single-digit growth and pockets of >20% CAGR where AI is involved.
Roughly 60%+ of global self-service technology spend is concentrated in Retail + QSR, with another ~20% across travel/hospitality, transportation, and gaming, and the remaining 15–20% spread across healthcare, parcel, BFSI, and attractions.
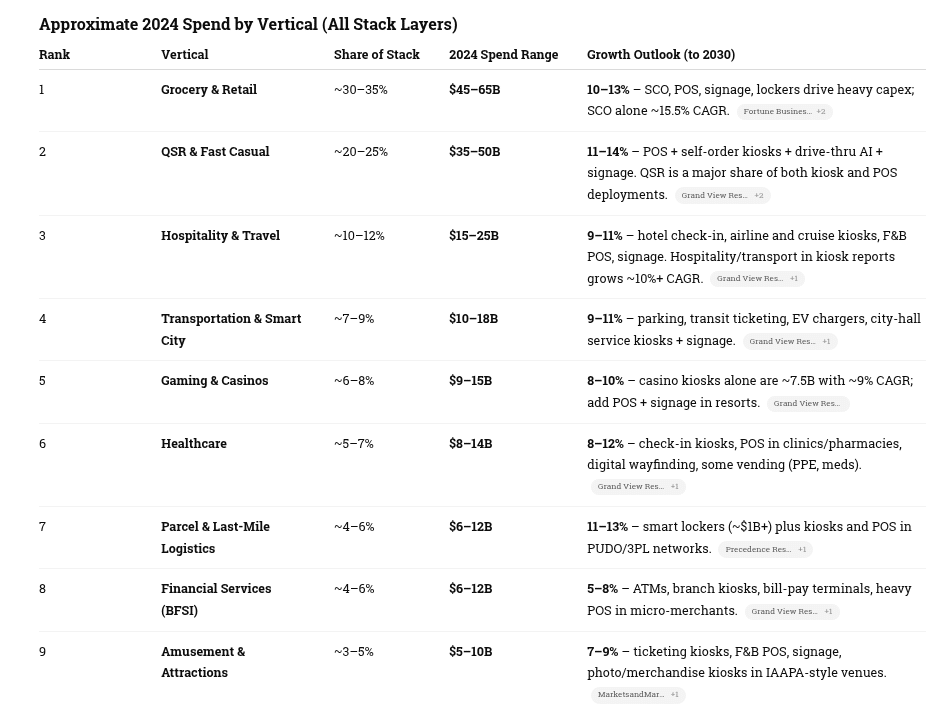
Click for full size — Overall self-service technology market and growth
Service…Did Someone Say Service?
1. High-Level Summary (Global, 2024)
Global service + warranty value across all self-service technology:
👉 Estimated $27–34 Billion per year
Broken down as:
-
Service / Maintenance: ~$21–27B
-
Extended Warranty: ~$6–7B
This scales with installed base growth, not new hardware shipments — which is the right way to model it.
2. How the Service/Warranty Market Works
For nearly all categories, service contracts fall into predictable ranges:
| Segment | Typical Service Cost Per Endpoint | Warranty/Extended Warranty |
|---|---|---|
| Kiosks | 8–12% of hardware value annually | 8–12% of hardware value per year |
| POS (fixed & mobile) | 12–18% annually | Often bundled, 8–12% per year |
| Digital Signage | 6–12% annually | 5–8% per year |
| Smart Vending | 12–20% annually | 10–12% per year |
| Smart Lockers | 10–14% annually | 8–10% per year |
| Conversational AI endpoints | 20–30% annually (software support) | Mostly software subscription |
These are the ratios I used to model global value.
3. The Big Calculation: Installed Base × Service Ratios
This is where the market really lives.
Below is a breakdown by technology class.
A. Interactive & Self-Service Kiosks
-
Installed base (global): 13–16 million units
-
Avg hardware cost: $3,000–8,000
-
Annual service/warranty spend:
≈ $6–8B
Includes:
-
Field service
-
RMA
-
Preventive maintenance
-
Remote monitoring
-
Software support
-
Onsite labor
B. Digital Signage
-
Installed base: >100 million screens (retail, QSR, transportation, OOH)
-
Annual service envelope:
≈ $5–7B
Breakdown:
-
Device monitoring
-
CMS support
-
Onsite swap
-
Calibration
-
Network connectivity / bandwidth mgmt.
Signage is huge because the screens are everywhere, even if per-device contracts are smaller.
C. POS Terminals (fixed + mobile)
-
Installed base: 140–180 million terminals
-
ASP service: $40–120 per terminal annually
-
Total service value:
≈ $8–10B
POS is by far the largest installed base of any self-service-related category, which drives a massive recurring MSP/ISO/VAR ecosystem.
D. Smart / Intelligent Vending
-
Installed base: 18–25 million machines
-
Annual service (highest ratio of all):
≈ $3–4B
Why so high?
-
Vending requires cleaning, replenishment, cash handling, refrigeration, robotics, etc.
-
Many operators outsource maintenance.
-
AI/smart vending pushes the service premium even higher.
E. Smart Lockers / Parcel Terminals
-
Installed base: 3–4 million units (global)
-
Annual service value:
≈ $1.2–1.7B
High because lockers require:
-
Door mechanism maintenance
-
Networking
-
SLA-driven uptime (especially in retail & campus settings)
F. Conversational Voice / AI Endpoints
-
Installed base: 200–300 million devices (but only 2–3 million true commercial endpoints)
-
Annual support:
≈ $0.5–1B
This is small today but is the fastest-growing category because:
-
Drive-thru AI requires continuous tuning
-
Hospitality/retail voice kiosks require hosted AI models
-
Contact center AI endpoints bleed into kiosk endpoints
Expect 20–30% CAGR for AI service contracts alone.
4. Market-Wide Total (All Categories)
Service + Warranty Market Size (Global, 2024)
| Category | Estimated Annual Value |
|---|---|
| Kiosks | $6–8B |
| Digital Signage | $5–7B |
| POS | $8–10B |
| Smart Vending | $3–4B |
| Smart Lockers | $1.2–1.7B |
| Conversational AI Endpoints | $0.5–1B |
| Total | $27–34B |
5. CAGR Outlook (Service Side Only)
Service and warranty grows slower than hardware except in AI.
| Category | Service CAGR Estimate (2024–2030) |
|---|---|
| Kiosks | 6–8% |
| Digital Signage | 7–9% |
| POS | 5–7% |
| Smart Vending | 11–13% |
| Smart Lockers | 10–12% |
| Conversational AI | 20–30% |
| Weighted Average | ~8–10% |
This means the global service market could reach:
$45–55B by 2030
The global service and warranty ecosystem surrounding self-service technology—kiosks, POS, digital signage, vending, lockers, and AI—is worth $27–34 billion annually, driven by the massive installed base of POS and digital signage and the high service intensity of kiosks and vending. By 2030 this will grow to $45–55 billion, with AI service contracts growing the fastest.
Grand Total — Global Self-Service Technology Market (2024)
👉 $180 Billion – $235 Billion per year
(Hardware + software + services + warranty + AI)
This is the correct “full stack” number for TIG/KMA positioning.
How the Total Breaks Down
A. Hardware + Software (core markets)
-
Interactive kiosks: $35B
-
Digital signage: $29B
-
Smart vending: $25B
-
POS terminals: $110B
-
Conversational AI software/platforms: $12B
Subtotal Hardware + Software = $150B – $185B
(Range reflects overlap, especially POS–kiosk–signage.)
B. Service + Warranty (attached value across all markets)
-
Kiosks: $6–8B
-
Digital signage: $5–7B
-
POS: $8–10B
-
Smart vending: $3–4B
-
Lockers: $1.2–1.7B
-
Conversational AI support: $0.5–1B
Subtotal Services + Warranty = $27B – $34B
GRAND TOTAL (A + B):
🎯 $180B – $235B Total Global Self-Service Ecosystem (2024)
| Layer | TIG Estimate | KMA Estimate | Notes |
|---|---|---|---|
| Core Kiosks | $8–15B | $8–15B | Fully aligned |
| Digital Signage | Typically treated separately | $45–55B | Massive uplift |
| POS Terminals | Excluded | $25–32B | The largest “adjacent” market |
| Vending + Micro-Markets | Excluded | $12–18B | Hot segment for 2025 |
| Smart Lockers | Excluded | $6–8B | Last-mile drivers |
| Retail Automation (SCO, scan-and-go) | Excluded | $20–30B | One of the fastest-growing |
| Voice/AI Endpoints | Minimal | $4–6B | New category |
| Service & Warranty | Included only partially | $27–34B | Biggest recurring bucket |
| TOTAL | $8–15B | $180–235B | Different scopes, not conflicting |
Addenda
Digital Screens and Digital Signage
Charts for RFPs in SLED sector
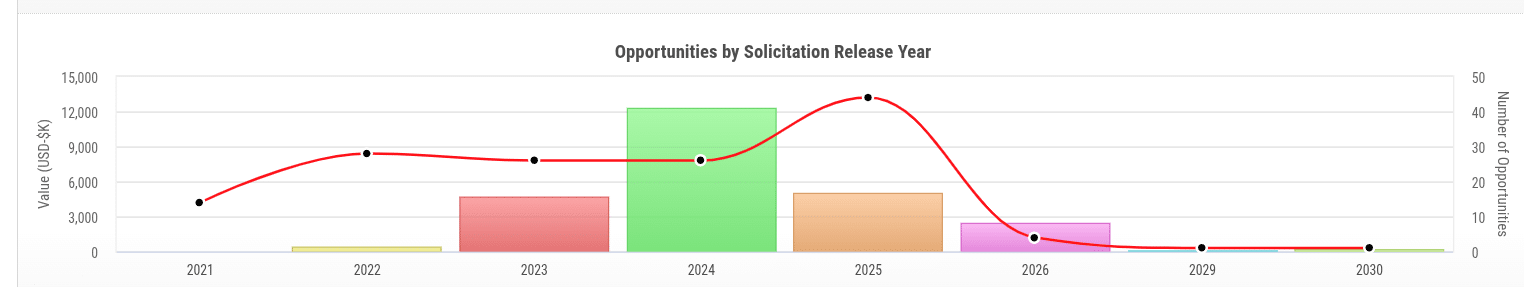

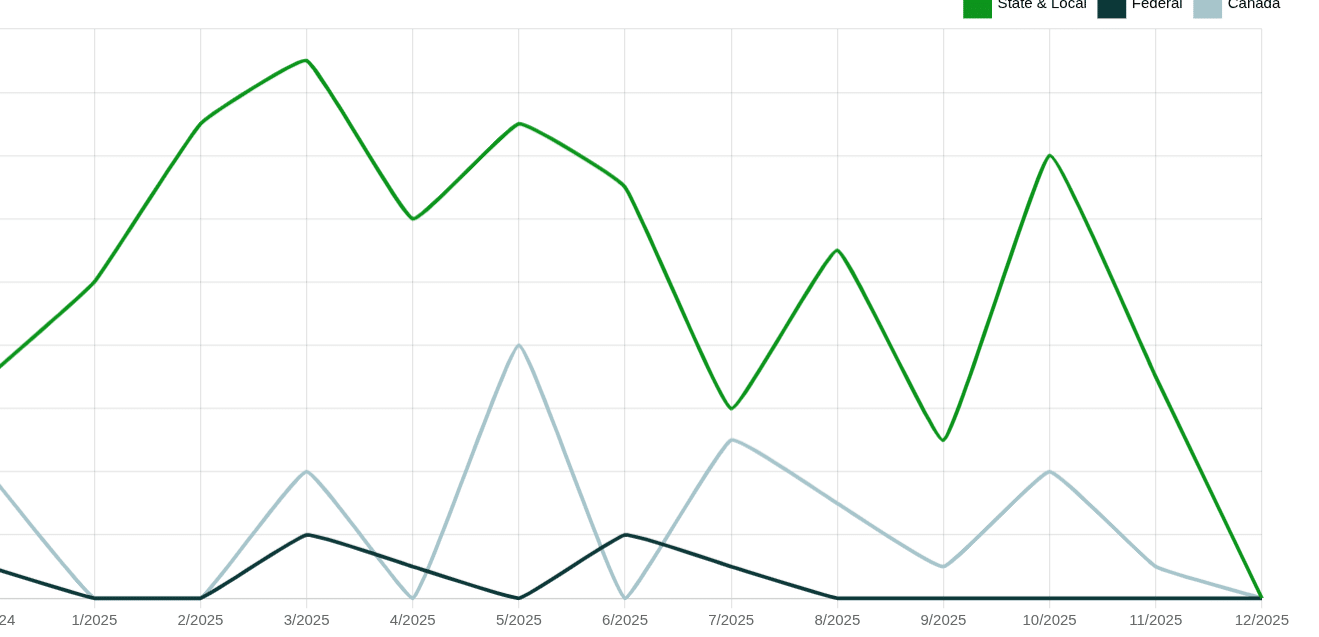
We have seen fewer opportunities in the SLED sector in 2025 and we track RFPs on weekly basis. We’ve included some charts below.
Commentary is from Tay Taehoon Kim who is Practice Leader, Head of ProAV research at Omdia. They do well-respected research.
LinkedIn Post — LCD/OLED/EPD Public display shipments in China and Western Europe boost 3Q global performance to 5.7% QoQ, despite dip in North America and Asia & Oceania. Each region has a unique set of strengths and challenges.
North America still contends with high interest rates, reporting a dip in public display shipments. Weakness in IFP/touch display shipments for North America continues to be evident in 3Q25 mainly due to weaker demand in the lower education market in the US than initially anticipated. Many K-12 school districts were impacted by reduced federal funding or are waiting to upgrade their displays in 2026 or later.
Third quarter public display results also reaffirm that, amid tariff implications in the US market, Chinese display vendors continue to focus sales efforts on other regions, such as Western Europe and the Middle East & Africa.
Despite an increase of QoQ for 3Q25, the lift in China’s public display market was mostly due to seasonality. Weakened demand in traditional education and classroom displays resulted YoY negative growth. Some of the shipments for IFP/touch displays were driven by AI+ functions through government policies, but budget issues remain. Additionally, corporate and conference room verticals are also limited by operation cost control from enterprises, with a shift in preference to signage and information display or signage TV products at a lower cost compared with IFP/touch displays.
Please check more detail from Kelly Lum‘s analyst opinion column (https://lnkd.in/gN9jWSNP).