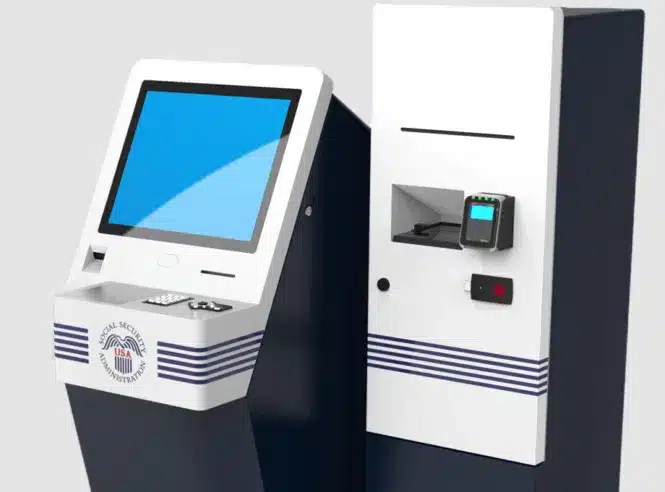
SSA check-in kiosks being deployed and they are brand new — From Montgomery Advertiser — down below we include actual tested parameters and the tool SSA uses along with spreadsheet with results.
Here are the key points:
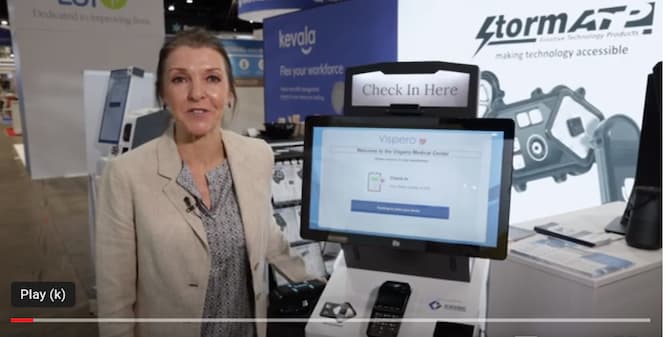
New Kiosks: Social Security offices have installed new kiosks to improve accessibility and privacy. These kiosks are ADA-compliant and easy to use.
Enhanced Check-In: Modifications have been made to assist customers who are blind or have low vision.
Mobile Check-In Express: Customers can now use their mobile devices to check in by scanning a QR code, making the process faster and more convenient.
Commitment to Accessibility: Social Security is dedicated to enhancing customer service and accessibility through these new technologies.
Excerpt:”Exciting News: Introducing New SSA Kiosks
At Social Security we strive to make our services more accessible while maintaining your privacy. We installed new kiosks in most of our local offices to make it easier for you to check in and conduct business with us. The kiosks are private, easy to use without assistance, and provide consistent service to our customers.
Modifications to earlier screens have improved the check-in process, especially for our customers who are blind or have low vision. Each kiosk is compliant with the Americans with Disabilities Act (ADA) and includes the following features:
Accessible keypads.
Audio headphone jacks (complimentary headphones are available upon request).
Braille instructions for how to use the kiosk and report any accessibility issues.
Built-in thermal printers and ticket dispensers.
Enhanced 508-compatible check-in software.
Touchscreen monitors with privacy filters.
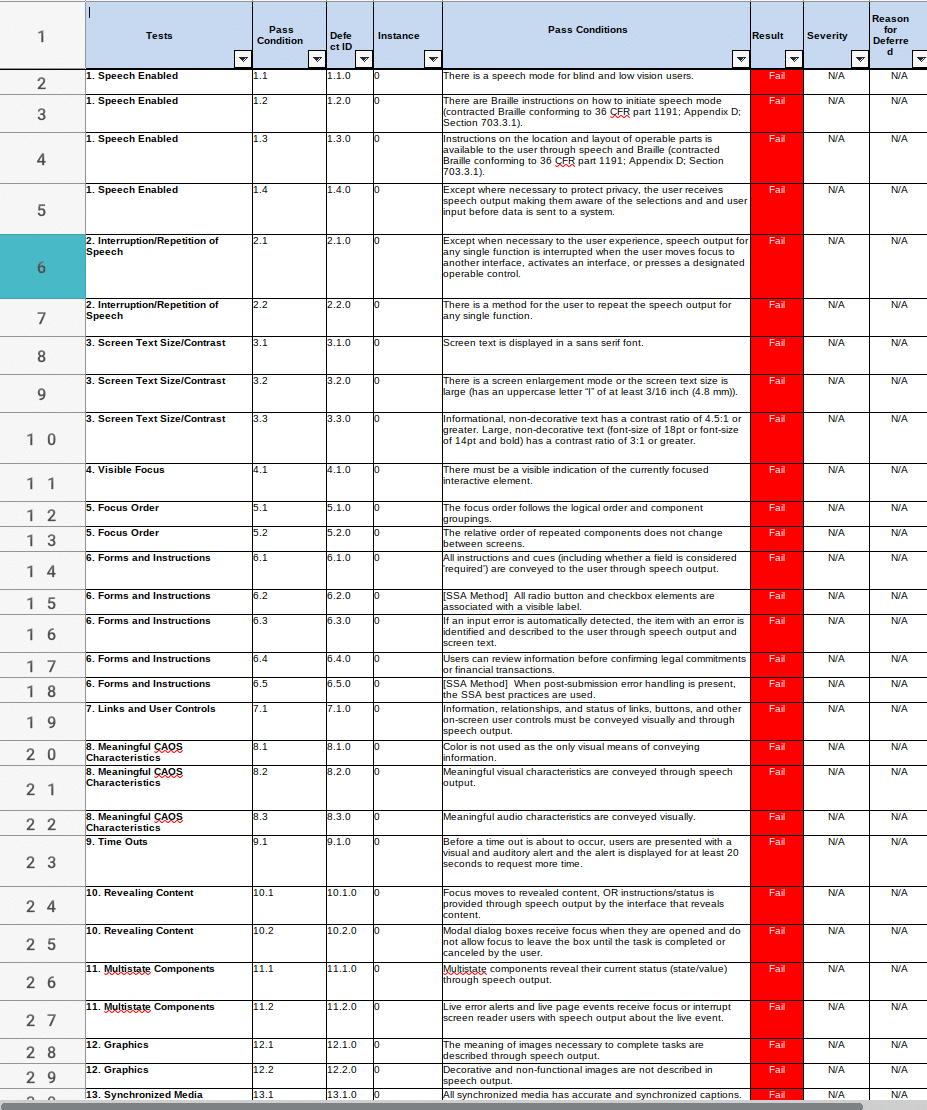
Here is a look at some of the parameters tested for.
The KMA is a sponsor for this program. The ANSI Electric Vehicles Standards Panel (EVSP) is a cross-sector coordinating body whose objective is to foster coordination and collaboration on standardization matters among public- and private-sector stakeholders to enable the safe, mass deployment of electric vehicles (EVs) and associated infrastructure in the United States with international coordination, adaptability, and engagement. The ANSI EVSP does not develop standards; rather, it serves as a forum for facilitating coordination among standards developing organizations (SDOs) and others.
ANSI invites organizations to sponsor Electric Vehicles Standards Panel (EVSP) program. Sponsorship opportunities and associated benefits are outlined in the attached flyer. All contributions (at any level) will directly help offset ANSI’s costs in executing this important work.
Over the past three years, the EVSP has been supported through a combination of federal funding (via DOE’s Argonne National Laboratory EVs@Scale program) and private-sector sponsorships, and is guided by an Advisory Group representing industry, the U.S. government, and standards and codes developers. With the conclusion of the EVs@Scale program in 2025, continued support is needed to sustain EVSP standards coordination activities. To that end, the ANSI EVSP Advisory Group is seeking new sponsors.
Past contributions resulted in the development and the publication of the Roadmap of Standards and Codes for Electric Vehicles at Scale which identified 37 standardization gaps addressing vehicle systems, charging infrastructure, grid integration, and cybersecurity. To support the maintenance and implementation of the Roadmap, the EVSP is now publishing Gaps Progress Reports to:
Report progress on research, standards, and codes activities
Review prioritization of topics and increase / decrease priority to guide resource allocation
Add to the discussion about the scoping and recommendations
Propose additional gaps based on the evolving research and technology landscape
As of October 2025, 30 of the 37 gaps have reported updates and 21 additional gaps have been suggested.
Those interested in supporting this initiative may contribute through the EVSP sponsorship portal. Please let me know if you have any questions.
Kiosks, Digital Signage & Unattended Retail Metrics by Kiosk Association
Self-service technology has moved far beyond simple ticketing or check-in. In 2025–2026, the strongest growth is coming from multi-modal automation ecosystems — kiosks, digital signage, vending, AI-driven POS, smart lockers, and cloud analytics. Across The Industry Group network, we consistently see a blend of labor efficiency, higher throughput, and better customer experience driving adoption.
Below is our 2025 report on the top-performing verticals, why they’re surging, and where OEMs, integrators, and operators should focus for the highest return. We look at self-service overall including service factors. We do not include ATMs or hybrid checkout as “kiosks”.
Our estimate is 180-250 Billion, total.
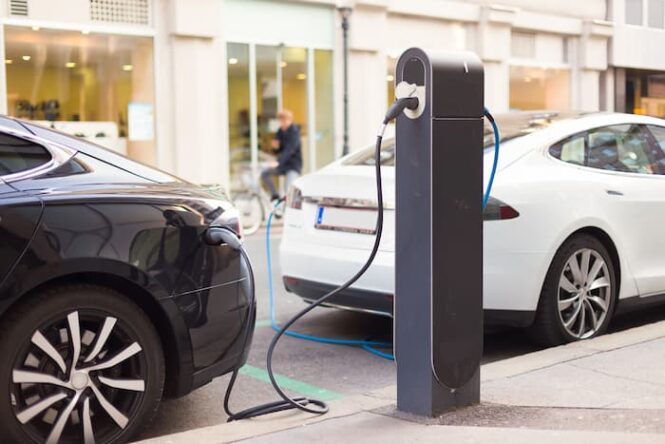
We will add supplemental markets in the Addenda such as EV charging stations which is a HUGE market. Hybrid POS in Grocery Store Self-Checkout (saturated) and also ATMs and the decline of.
Notes:
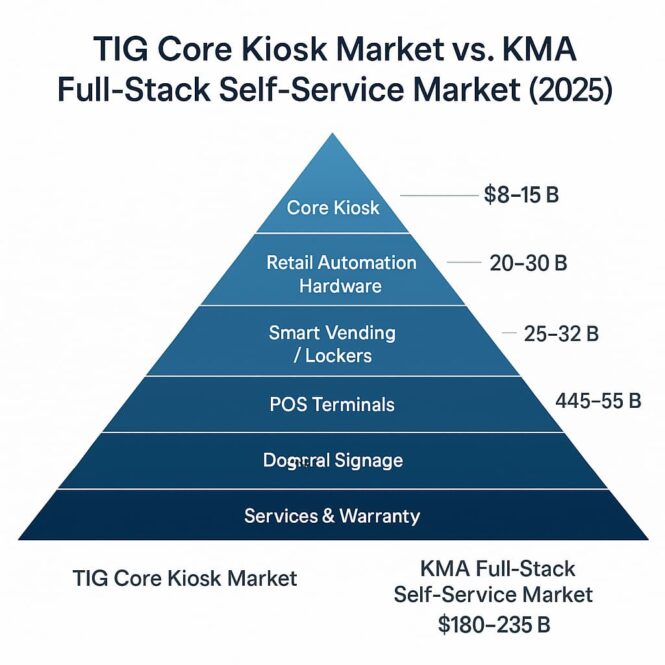
The TIG core kiosk market sits at $8–15B — a clean number that reflects true, interactive kiosks only.
The KMA full-stack market (digital signage, POS, lockers, vending, AI, and service) lands at $180–235B.
These are not contradictory estimates — they represent different scopes.
Kiosks are the nucleus, but the broader self-service automation ecosystem is now 12–15× larger.
Analysts get wildly inflated numbers when they blur these boundaries.
Top Verticals Overview (2025–2026)
1. QSR & Fast Casual Restaurants
Demand for kiosks, menu boards, AI-ordering, and pickup lockers continues to outpace all other sectors. Upsell automation alone drives some of the fastest ROI.
2. Grocery & Retail
Shrink reduction, returns automation, and BOPIS/locker fulfillment dominate the investment cycle.
3. Healthcare & Patient Intake
Staffing gaps + regulatory pressure = explosive growth for check-in, ID verification, and wayfinding kiosks. Healthcare is huge for EV charging stations.
4. Hospitality & Travel
Airlines, hotels, and attractions aim for higher throughput and fast smooth “memorable” guest journeys.
5. Amusement, Attractions & Entertainment
IAAPA’s strongest segment: ticketing, photo capture, F&B kiosks, digital signage, and smart lockers.
Vertical
Key Use Cases
Primary Tech
ROI Strength
QSR & Fast Casual
Self-ordering, menu boards, pickup lockers
Kiosks, AI ordering, POS, digital signage
★★★★★
Grocery & Retail
SCO, returns, BOPIS lockers, endless aisle
Kiosks, lockers, signage, vision systems
★★★★★
Healthcare
Patient check-in, ID verify, wayfinding
Kiosks, secure payments, signage, queueing
★★★★☆
Hospitality & Travel
Hotel check-in, ticketing, bag tag
Kiosks, signage, POS, credentialing
★★★★☆
Amusement & Attractions
Ticketing, photo, F&B, lockers
Kiosks, digital signage, RFID lockers
★★★★☆
Gaming & Casinos
TITO, loyalty, sports betting, cage automation
Secure kiosks, AML/KYC, signage
★★★★★
Transportation & Smart City
EV/parking, transit ticketing, permits
Kiosks, chargers, signage, payments
★★★☆☆
Parcel & Last-Mile Logistics
Returns, package pickup, refrigerated lockers
Smart lockers, kiosks, RFID
★★★★☆
Financial Services
ATM, bill pay, cash-to-card
Kiosks, POS terminals, ID verify
★★★☆☆
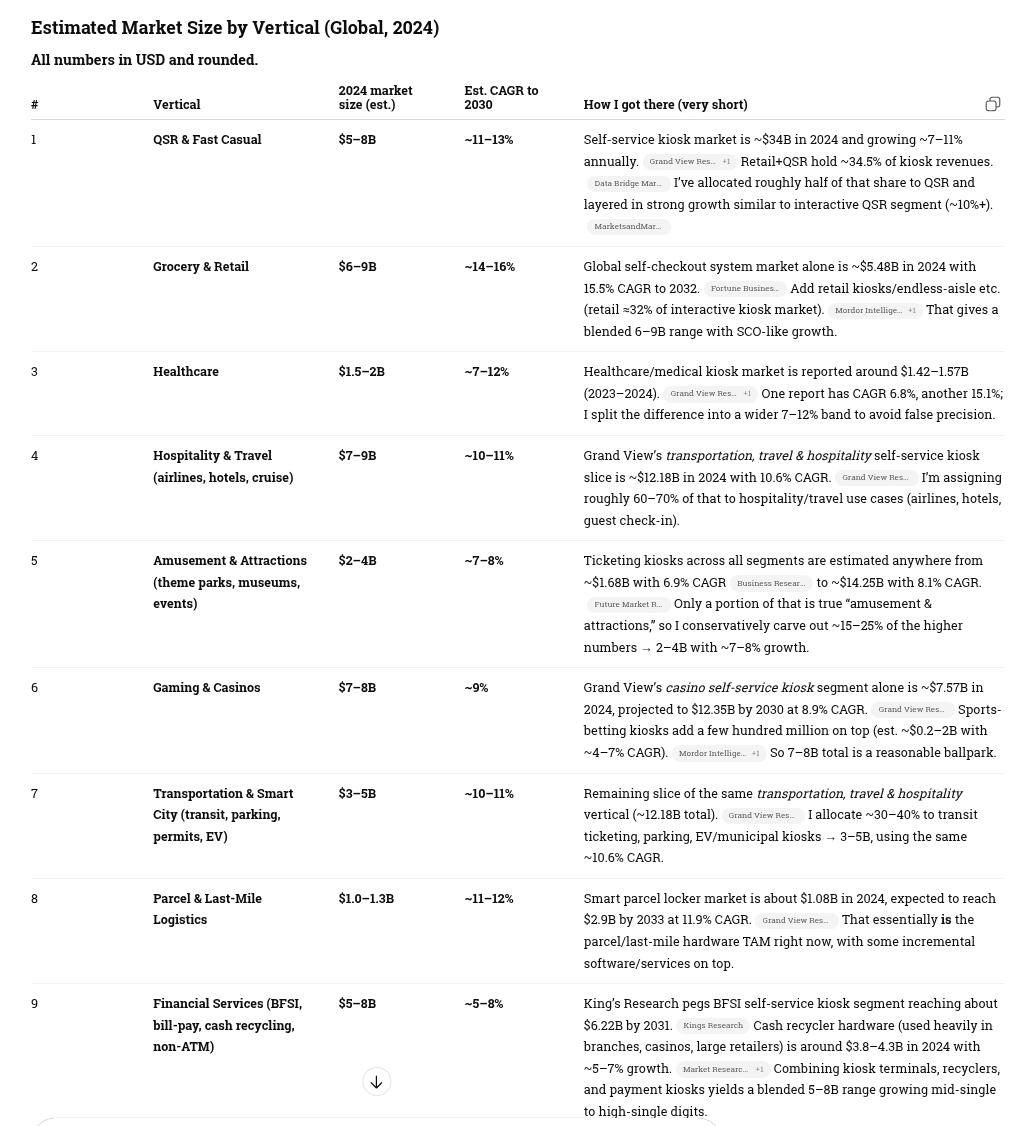
So what about kiosk market share and growth?
Click for full size — kiosk market share by vertical with growth
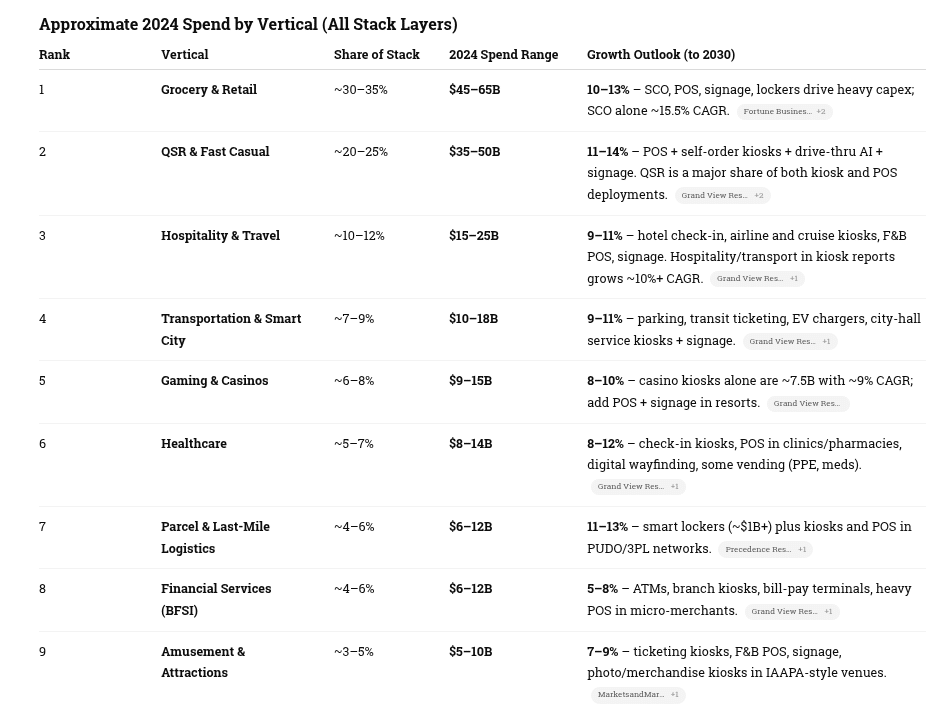
Ok — What About Self-Service Overall? Let the Big Dog Eat!
If we naïvely add the midpoints we get ≈$210B global spend in 2024 across the stack. That overstates true TAM because:
POS is used in many non–self-service scenarios.
Kiosks and vending often embed POS and sometimes digital signage displays.
Conversational AI runs both on self-service endpoints and on contact-centre / web channels.
The global self-service technology stack—kiosks, POS, digital signage, smart vending, and conversational AI—sits in the $150–200B range today, with blended high-single-digit growth and pockets of >20% CAGR where AI is involved.
Roughly 60%+ of global self-service technology spend is concentrated in Retail + QSR, with another ~20% across travel/hospitality, transportation, and gaming, and the remaining 15–20% spread across healthcare, parcel, BFSI, and attractions.
Click for full size — Overall self-service technology market and growth
Service…Did Someone Say Service?
1. High-Level Summary (Global, 2024)
Global service + warranty value across all self-service technology:
👉 Estimated $27–34 Billion per year
Broken down as:
Service / Maintenance: ~$21–27B
Extended Warranty: ~$6–7B
This scales with installed base growth, not new hardware shipments — which is the right way to model it.
2. How the Service/Warranty Market Works
For nearly all categories, service contracts fall into predictable ranges:
Segment
Typical Service Cost Per Endpoint
Warranty/Extended Warranty
Kiosks
8–12% of hardware value annually
8–12% of hardware value per year
POS (fixed & mobile)
12–18% annually
Often bundled, 8–12% per year
Digital Signage
6–12% annually
5–8% per year
Smart Vending
12–20% annually
10–12% per year
Smart Lockers
10–14% annually
8–10% per year
Conversational AI endpoints
20–30% annually (software support)
Mostly software subscription
These are the ratios I used to model global value.
3. The Big Calculation: Installed Base × Service Ratios
This is where the market really lives.
Below is a breakdown by technology class.
A. Interactive & Self-Service Kiosks
Installed base (global): 13–16 million units
Avg hardware cost: $3,000–8,000
Annual service/warranty spend: ≈ $6–8B
Includes:
Field service
RMA
Preventive maintenance
Remote monitoring
Software support
Onsite labor
B. Digital Signage
Installed base: >100 million screens (retail, QSR, transportation, OOH)
Annual service envelope: ≈ $5–7B
Breakdown:
Device monitoring
CMS support
Onsite swap
Calibration
Network connectivity / bandwidth mgmt.
Signage is huge because the screens are everywhere, even if per-device contracts are smaller.
C. POS Terminals (fixed + mobile)
Installed base: 140–180 million terminals
ASP service: $40–120 per terminal annually
Total service value: ≈ $8–10B
POS is by far the largest installed base of any self-service-related category, which drives a massive recurring MSP/ISO/VAR ecosystem.
D. Smart / Intelligent Vending
Installed base: 18–25 million machines
Annual service (highest ratio of all): ≈ $3–4B
Why so high?
Vending requires cleaning, replenishment, cash handling, refrigeration, robotics, etc.
Many operators outsource maintenance.
AI/smart vending pushes the service premium even higher.
E. Smart Lockers / Parcel Terminals
Installed base: 3–4 million units (global)
Annual service value: ≈ $1.2–1.7B
High because lockers require:
Door mechanism maintenance
Networking
SLA-driven uptime (especially in retail & campus settings)
F. Conversational Voice / AI Endpoints
Installed base: 200–300 million devices (but only 2–3 million true commercial endpoints)
Annual support: ≈ $0.5–1B
This is small today but is the fastest-growing category because:
Drive-thru AI requires continuous tuning
Hospitality/retail voice kiosks require hosted AI models
Contact center AI endpoints bleed into kiosk endpoints
Expect 20–30% CAGR for AI service contracts alone.
4. Market-Wide Total (All Categories)
Service + Warranty Market Size (Global, 2024)
Category
Estimated Annual Value
Kiosks
$6–8B
Digital Signage
$5–7B
POS
$8–10B
Smart Vending
$3–4B
Smart Lockers
$1.2–1.7B
Conversational AI Endpoints
$0.5–1B
Total
$27–34B
5. CAGR Outlook (Service Side Only)
Service and warranty grows slower than hardware except in AI.
Category
Service CAGR Estimate (2024–2030)
Kiosks
6–8%
Digital Signage
7–9%
POS
5–7%
Smart Vending
11–13%
Smart Lockers
10–12%
Conversational AI
20–30%
Weighted Average
~8–10%
This means the global service market could reach:
$45–55B by 2030
The global service and warranty ecosystem surrounding self-service technology—kiosks, POS, digital signage, vending, lockers, and AI—is worth $27–34 billion annually, driven by the massive installed base of POS and digital signage and the high service intensity of kiosks and vending. By 2030 this will grow to $45–55 billion, with AI service contracts growing the fastest.
Grand Total — Global Self-Service Technology Market (2024)
👉 $180 Billion – $235 Billion per year
(Hardware + software + services + warranty + AI)
This is the correct “full stack” number for TIG/KMA positioning.
How the Total Breaks Down
A. Hardware + Software (core markets)
Interactive kiosks: $35B
Digital signage: $29B
Smart vending: $25B
POS terminals: $110B
Conversational AI software/platforms: $12B
Subtotal Hardware + Software = $150B – $185B
(Range reflects overlap, especially POS–kiosk–signage.)
B. Service + Warranty (attached value across all markets)
Kiosks: $6–8B
Digital signage: $5–7B
POS: $8–10B
Smart vending: $3–4B
Lockers: $1.2–1.7B
Conversational AI support: $0.5–1B
Subtotal Services + Warranty = $27B – $34B
Grand Total — Global Self-Service Technology Market (2024)
👉 $180 Billion – $235 Billion per year
(Hardware + software + services + warranty + AI)
This is the correct “full stack” number for TIG/KMA positioning.
How the Total Breaks Down
A. Hardware + Software (core markets)
Interactive kiosks: $35B
Digital signage: $29B
Smart vending: $25B
POS terminals: $110B
Conversational AI software/platforms: $12B
Subtotal Hardware + Software = $150B – $185B
(Range reflects overlap, especially POS–kiosk–signage.)
B. Service + Warranty (attached value across all markets)
Kiosks: $6–8B
Digital signage: $5–7B
POS: $8–10B
Smart vending: $3–4B
Lockers: $1.2–1.7B
Conversational AI support: $0.5–1B
Subtotal Services + Warranty = $27B – $34B
GRAND TOTAL (A + B):
🎯 $180B – $235B Total Global Self-Service Ecosystem (2024)
Layer
TIG Estimate
KMA Estimate
Notes
Core Kiosks
$8–15B
$8–15B
Fully aligned
Digital Signage
Typically treated separately
$45–55B
Massive uplift
POS Terminals
Excluded
$25–32B
The largest “adjacent” market
Vending + Micro-Markets
Excluded
$12–18B
Hot segment for 2025
Smart Lockers
Excluded
$6–8B
Last-mile drivers
Retail Automation (SCO, scan-and-go)
Excluded
$20–30B
One of the fastest-growing
Voice/AI Endpoints
Minimal
$4–6B
New category
Service & Warranty
Included only partially
$27–34B
Biggest recurring bucket
TOTAL
$8–15B
$180–235B
Different scopes, not conflicting
Addenda
Digital Screens and Digital Signage
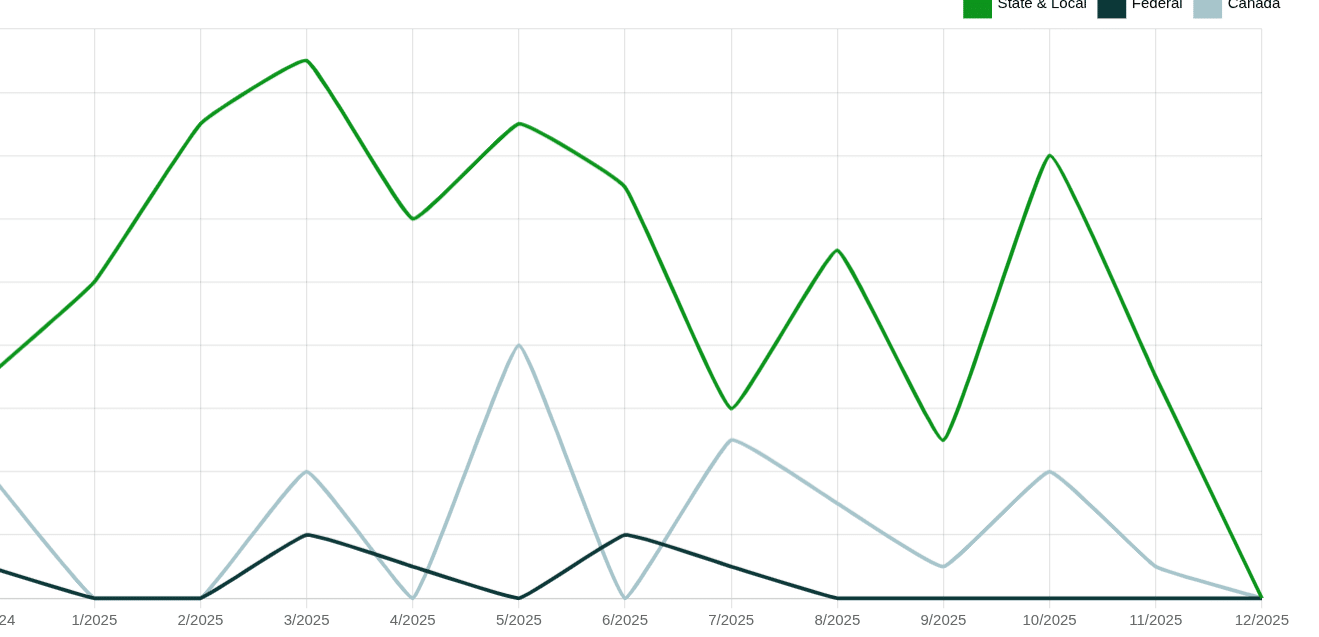
We have seen fewer opportunities in the SLED sector in 2025 and we track RFPs on weekly basis. We’ve included some charts below.
Commentary is from Tay Taehoon Kim who is Practice Leader, Head of ProAV research at Omdia. They do well-respected research.
LinkedIn Post — LCD/OLED/EPD Public display shipments in China and Western Europe boost 3Q global performance to 5.7% QoQ, despite dip in North America and Asia & Oceania. Each region has a unique set of strengths and challenges.
North America still contends with high interest rates, reporting a dip in public display shipments. Weakness in IFP/touch display shipments for North America continues to be evident in 3Q25 mainly due to weaker demand in the lower education market in the US than initially anticipated. Many K-12 school districts were impacted by reduced federal funding or are waiting to upgrade their displays in 2026 or later.
Third quarter public display results also reaffirm that, amid tariff implications in the US market, Chinese display vendors continue to focus sales efforts on other regions, such as Western Europe and the Middle East & Africa.
Despite an increase of QoQ for 3Q25, the lift in China’s public display market was mostly due to seasonality. Weakened demand in traditional education and classroom displays resulted YoY negative growth. Some of the shipments for IFP/touch displays were driven by AI+ functions through government policies, but budget issues remain. Additionally, corporate and conference room verticals are also limited by operation cost control from enterprises, with a shift in preference to signage and information display or signage TV products at a lower cost compared with IFP/touch displays.
Given the nature of ROI and how it is different for transactional kiosks versus information kiosks, the primary device enabler are the actual POS terminals. We often refer to them as “warts”. It is a very large and complex market and we can only scratch the surface as far as data.
Some general POS observations
Definition of POS device is a card ready EMV device.
Android is probably 60% of those
The big three are always Ingencio (Worldline), Verifone and PAX
Don’t forget key injection is mandatory.
Unattended is seen differently than Attended by PCI DSS
Large deployers (Home Depot e.g.) use attended terminals in unattended mode negotiating liability release due to purchase levels.
Cost of using a non-compliant terminal is 10X-100X the cost of compliance.
Spec’s Liquor Stores — acquirer withheld $6.2 million in settlement funds.
Brand penalties are $5000 to $25,000 a month. Up to $500,000 in subsequent fine.
If specific details are desired then contact UCP Inc. — they are prime distributor in US and UK. Rob Chilcoat is CEO and smart guy.
ADA Compliance and Promoting Inclusivity Through Digital Signage, Wayfinding and Mobile Integration
Most digital signage is simply static one-way content presentation. The growing part of the overall digital signage market is Interactive. The 22Miles E-Book provides an overview of ADA (Americans with Disabilities Act) compliance in higher education, focusing on the integration of interactive digital signage and mobile technology to foster inclusivity and equal access for all students, especially those with disabilities. ADA is usually referenced in terms of kiosks and physical reach requirements. Too often digital signage or wayfinding is neglected as is basic ABA requirements for placements. ADA and accessibility is a full equation. Reference Link
Main Topics
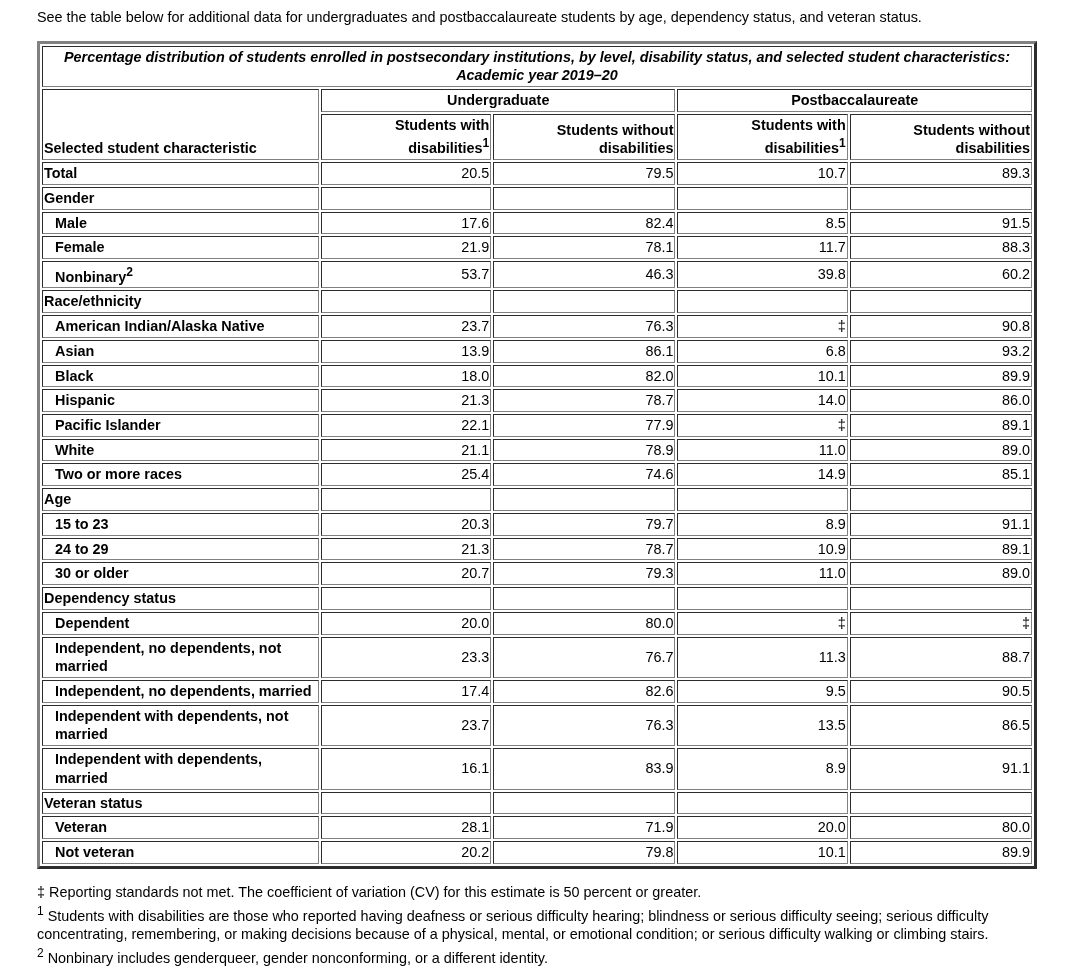
The booklet highlights that roughly 1 in 5 college students has a disability, emphasizing the legal and ethical responsibilities of educational institutions to guarantee equal access to information and experiences on campus for every student.
Datapoint from National Center for Education Statistics — Among undergraduates, the percentage who reported having a disability was
It discusses how the ADA mandates access not only to physical spaces but also to digital content—meaning digital signage and information displays must accommodate those with mobility, visual, hearing, and cognitive impairments.
The document points out the risks of non-compliance, including legal actions, financial penalties, and reputational harm for institutions failing to meet ADA requirements.
ADA-Compliant Digital Signage & Mobile Integration
The guide describes features needed for ADA-compliant digital signage: compatibility with screen readers, alternative text for images, content placement at accessible heights, captions for videos, and adjustable text sizes.
It introduces advanced accessibility features such as text-to-speech, voice control, onscreen magnification, mobile wayfinding, and integration with users’ smartphones to allow touchless interaction—improving accessibility for a variety of disabilities.
Mobile integration is a key theme, with the solution allowing users to scan QR codes on digital signage to transfer content to their phones, control digital signage remotely, and utilize their preferred accessible tools on personal devices.
Benefits and Institutional Impact
Adopting these solutions leads to increased accessibility, a unified and intuitive user experience, higher student engagement and satisfaction, improved institutional reputation, and better student retention and performance rates.
The product highlighted, “22Miles Carry2Mobile,” enables personalized, continuous access to campus information for disabled students by connecting digital signage with their smartphones.
Conclusion
The ebook argues that integrating ADA-compliant digital signage and mobile technologies is essential for colleges aiming to be fully inclusive and meet both legal obligations and the expectations of modern, tech-savvy students.
It positions these steps not only as compliance but as strategic advantages that improve campus experience, protect from legal risk, and enhance institutional standing in the competitive higher education environment.
How To Implement — Checklist for Digital Signage ADA
13 Key Elements of a Digital Signage ADA Checklist
Requirements : The same requirements for static content presentation via digital signage (think FIDs at airport) apply to interactive digital. Interactive adds additional requirements.
Testing : Integrate user testing (with diverse personas) during both design and post-deployment phases. If audio is utilized, then check in a high ambient noise level environment (think Vegas restaurant…)
Screen Reader Compatibility: Ensure all content is accessible to screen readers, including text descriptions for images.
Captions and Transcripts: Provide captions for all audio/video content and transcripts where appropriate.
Simple, Understandable Text: Use clear, jargon-free language easily understood by everyone, including those with cognitive disabilities.
Touchless and Accessible Interfaces: Implement touchless technology (e.g., motion sensors, mobile controls) and ensure large, easy-to-use buttons for those with mobility impairments.
Physical Placement: Mount signage at accessible heights and locations for all users, including people using wheelchairs.
High-Contrast, Non-Glare Finishes: Use high-contrast text, non-glare materials, and tactile features like Braille for permanent signs and room identifiers.
Ongoing Testing and Feedback: Regularly review, update, and seek user feedback to maintain compliance as technologies and standards change.
Mobile Phones – Don’t rely on Mobile Phones to provide accessibility to big screens.
Mobile Phones – Make sure your mobile phone app is accessible
Regulations — Consider a VPAT
Cost — You can start small — retrofit one building; integrate with existing screens; plan for incremental upgrades. Getting sued can be an expensive lesson. See legal actions for lessons learned and fines levied.
The U.S. Department of Transportation (DOT) recently issued an Interim Final Rule (IFR) amending the DOT’s Disadvantaged Business Enterprise (DBE) regulations to remove race- and sex-based presumptions from the definition of “socially and economically disadvantaged individual”, and an IFR Guidance Document.
For more information, please refer to the detailed updatehereand attached.
Great article on user UX and UI from September 2025
Our most common advice (rarely followed) is test with multiple persona and real people. Be sure to check accessibility. Create a consensus impression opinion. Much safer than using diversity politically these day (or even disabled). There are tools from Cambridge that can help you do that. Sitekiosk is a great tool. Many use Intuiface for that matter. The more powerful, the more complex equates most often to the longer and steeper the learning curve. Testing with your developers is virtual suicide. They told you it would take 2 months, and it’s already been 6 months.
Designing a secure and seamless kiosk user experience (UX) requires clarity, simplicity, and robust security, with special emphasis on reducing user errors and friction at every step. Organizations benefit from prioritizing accessible, intuitive, and touch-friendly interfaces that create smooth, trustworthy self-service experiences for all users.
Why Kiosk UX Is Critical
A well-designed kiosk boosts user satisfaction and repeat business, while poor UX causes frustration and abandonment. Simplifying each interaction point—through clear directions, uncluttered layouts, and universal icons—directly improves workflows and competitiveness.
Sources of Kiosk Friction
Typical friction points include confusing navigation, micro-errors, poor accessibility, and cluttered screens. Research shows current kiosks score below desired usability benchmarks, highlighting the need for design improvements that promote clarity and confidence at every stage.
Best Practices for Great Kiosk UX
Simplicity First: Use concise prompts and ample white space; adopt high-contrast, visually guided designs.
Touch-Friendly Design: Enlarge buttons and ensure proper spacing to avoid mistakes, with touch feedback and accessibility features like screen reader support.
Linear, Predictable Workflows: Eliminate unnecessary steps; provide progress indicators and easy review/edit options before submission.
Consistent Brand Experience: Maintain visual and interaction cohesion throughout the kiosk journey to build trust and reduce drop-off rates.
Reducing Errors and Enhancing Accessibility
Clear Messaging: Use positive, instructive language and visual cues for every state, including errors and subsequent actions.
Multilingual/Multimodal Support: Offer text localization, text-to-speech, and audio cues to accommodate users with diverse abilities and language needs.
Confirmation and Edits: Enable straightforward review and correction paths before final transaction steps to minimize costly errors.
Security and Trust
UX must integrate robust security through session management, browser lockdown, and hardware protections while maintaining ease of use. Regular maintenance and updates are essential for continued protection.
Real-World Impact and Pandemic Influence
Restaurants, healthcare, retail, and banking use interactive kiosks to increase accuracy, speed, and convenience. COVID-19 prompted more touch-free, hygienic solutions such as QR codes, voice controls, and visible cleaning routines, further shaping expectations for safe public interfaces.
Creative Tools and Usability Testing
Designers use drag-and-drop templates, content libraries, and analytics dashboards to rapidly prototype and optimize flows. The key to continuous improvement is real-world usability testing, gathering feedback, and iteratively refining designs for maximum usability and Net Promoter Scores (NPS).
Actionable Checklist
Employ large, responsive touchpoints
Declutter screens, streamline steps
Prioritize accessibility and clarity in communication
Ensure brand consistency
Support multilingual needs
Provide clear confirmations and navigation paths
Balance security with usability
Use analytics beyond “happy path” test cases
Continuously test and refine in live environments
Successful kiosk UX blends creativity, empathy, and technical skill. By focusing on clarity, accessibility, and security, businesses deliver digital signage and kiosks that foster loyalty and provide real, lasting value in the self-service landscape.
10 Rules for Designing Digital Signage Content – ScreenCloud[12]
Digital Kiosks: Unlock Inclusive Self-Service Experiences – levelaccess.com[13]
Mastering Kiosk Design: Best Practices for Exceptional User Experience – patchretention.com[14]
Digital Signage Inspiration, Designs, and UI/UX Examples – Dribbble[15]
Industry Considerations: How to Make an Accessible Kiosk – TPGi[16]
Effective UX UI Design for Self Service Kiosks: Best Practices & Tips – flyx.cloud[17]
How to Make a Digital Signage Solution – Reddit[18]
Linux Kiosk Security Guide: Best Practices for Management and Safety – linuxsecurity.com[19]
Digital Signage Resources, Free Online Tools & Content – visix.com[20]
These resources cover practical guidance, case studies, accessible design, security, and creative inspiration for anyone working on kiosk and digital signage experiences.
This page on legal actions in self-service and related is a running log with personal commentary on legal, privacy and patent situations which impact unattended self-service. We keep track of legal news that affects the unattended self-service market. One of the best articles to monitor is Kiosk Accessibility: The Law is Paying Attention by Lainey Feingold. Another great source is Understanding The ADA blog by William Goren.
Legal actions can also be HIPAA violations of privacy data and also web accessibility (WCAG usually), which have financial and legal consequences. If you have news of note send us an email at info@kioskindustry.org
Notable Legal Actions and Related In Brief:
Apr 2023
Biometrics and Illinois – Christian Dior’s virtual “try on” glasses wins in Illinois under BIPA and facial recognition. Link
ADA Tester of Hotels SCOTUS to rule on — In the court papers, Acheson’s lawyers claimed that Laufer had filed over 600 lawsuits since 2018 targeting small hotels and bed and breakfasts and that the cost of litigating a case might put defendants into bankruptcy. “A cottage industry has arisen in which uninjured plaintiffs lob ADA lawsuits of questionable merit while using the threat of attorney’s fees to extract settlement payments,” Acheson’s lawyers said.
Mar 2023
US Supreme Court Backs Deaf Student — The U.S. Supreme Court on Tuesday allowed a deaf student in Michigan to sue his public school district for allegedly failing to provide him adequate classroom instruction, a ruling that bolsters the ability of students with disabilities to remedy shortcomings in their education. From Willian Goren —
CVS and Dalton –– CVS class action claims blind, low-vision customers cannot independently use HealthHub kiosks. CVS Health Corporation failed to make its CVS HealthHub self-service kiosks independently usable for individuals who are blind or visually impaired, a new class action lawsuit alleges. Dalton vs. CVS Lawsuit Brief — Here are some pictures of Healthhub kiosks which are basically cheap mounted tablets. LINK
Biometrics and Maryland — link on Biometric Update – State of Maryland legislators are debating five bills (four cross-filed and one separate) addressing biometric and other private data collected by private organizations as part of doing business. Members of the Computer & Communications Industry Association issued a statement saying any legislation needs to be narrowly written to protect “high-risk practices,” although without spelling out what that means.
Employees, Biometrics & Fingerprints — White Castle facing a fine of $17B for violating privacy of employees with fingerprint scanner. On February 17, 2023, the Illinois Supreme Court held that each scan or transmission of a person’s biometric identifiers is a separate violation of Illinois’ Biometric Information Privacy Act (BIPA). In Cothron v. White Castle System, Inc., 2023 IL 128004, the plaintiff was an employee at a White Castle restaurant. She alleged that White Castle, without obtaining the statutorily mandated consent, required her to scan her fingerprint multiple times each day to access company systems. The plaintiff argued that each scan since BIPA’s enactment in 2008 was a separate violation. White Castle argued that if any violation occurred, it was a single violation in 2008, when it first collected her fingerprints without obtaining proper consent. Thereafter, White Castle argued, each new scan was not a new “collection” of her fingerprints. By a 4-3 majority, the court agreed with the plaintiff that each scan was a separate violation. National Law Review, White Castle could face multibillion-dollar judgment in Illinois privacy lawsuit,
Nearly 2,000 lawsuits alleging violations of BIPA have been filed since 2017, yielding a series of massive settlements and judgments. Amazon, Facebook and others.
January 2023
Voice Recognition — Whole Foods Reaches $300k BIPA Settlement Over Voice Recognition Lawsuit — Whole Foods has reached a $297,000 settlement in a lawsuit filed under Illinois’s Biometric Information Privacy Act (BIPA). The lawsuit alleged that Whole Foods enrolled distribution center workers in a voice recognition system without properly obtaining consent and providing the necessary disclosures as required under BIPA. The settlement, which has received early approval from a state court judge, would see $545 paid out to each of the class action’s 330 workers.
Hotels and restaurants across Europe are facing the same challenge: how to provide guests with clear, accessible information about ingredients, allergens, and nutritional values—while staying compliant with EU food labeling regulations.
The solution? NutriHotel + SiteKiosk.
🔹 NutriHotel streamlines recipe management, automatically capturing nutritive values, allergens, and additives
🔹 SiteKiosk takes that data and delivers it securely and intuitively via guest-facing touch displays
This powerful combination ensures that:
– Guests can explore menus with confidence, thanks to multilingual info and allergen icons
– Hoteliers stay fully compliant with EU Regulation 1169/2011
– Updates are instant and centralized—no manual reprints, no confusion
– The dining experience is elevated, building trust and satisfaction
In the case of NutriHotel, the integration with SiteKiosk has proven to be a game-changer: easy implementation, secure management, and a modern, guest-friendly interface.
At SiteKiosk, we’re proud to support hospitality businesses in delivering not only excellent service, but also transparency, safety, and innovation at every touchpoint.
SiteKiosk’s case study on NutriHotel showcases how hotels and restaurants leverage a digital, multilingual platform to present menus and transparent allergen information to guests, using secure SiteKiosk-powered touchscreens for a safer, smarter hospitality experience.
Key Points
NutriHotel brings it all together: foodservice info managed digitally, menus always current, and allergen details front and center—no paper forms, no guessing.
Touchscreen kiosks make sure every guest gets the dish info they need, in the language they want, whether German, English, or French—for trust and transparency, right at the point of sale.
Hotels and restaurants save time; staff can focus on serving, screens take care of details and updates.
SiteKiosk powers it behind the scenes: secure, easy to manage, and ready to run 24/7—so management gets peace of mind.
End result: guests feel confident, operations more efficient, and the hospitality business looks tech-savvy—just how Craig Keefner likes it, digital done right.
Here is a concise, one-page WCAG 2.2 AA checklist for developers, focusing on practical implementation steps and covering both continuing AA requirements and new 2.2 additions.
The Web Content Accessibility Guidelines or WCAG provides technical Mobile specifications to improve the accessibility of web content, websites and Improves support for touch web applications on desktop computers, laptops, tablets and mobile devices for people with a wide range of disabilities, including auditory, cognitive, neurological, physical, speech and visual disabilities.
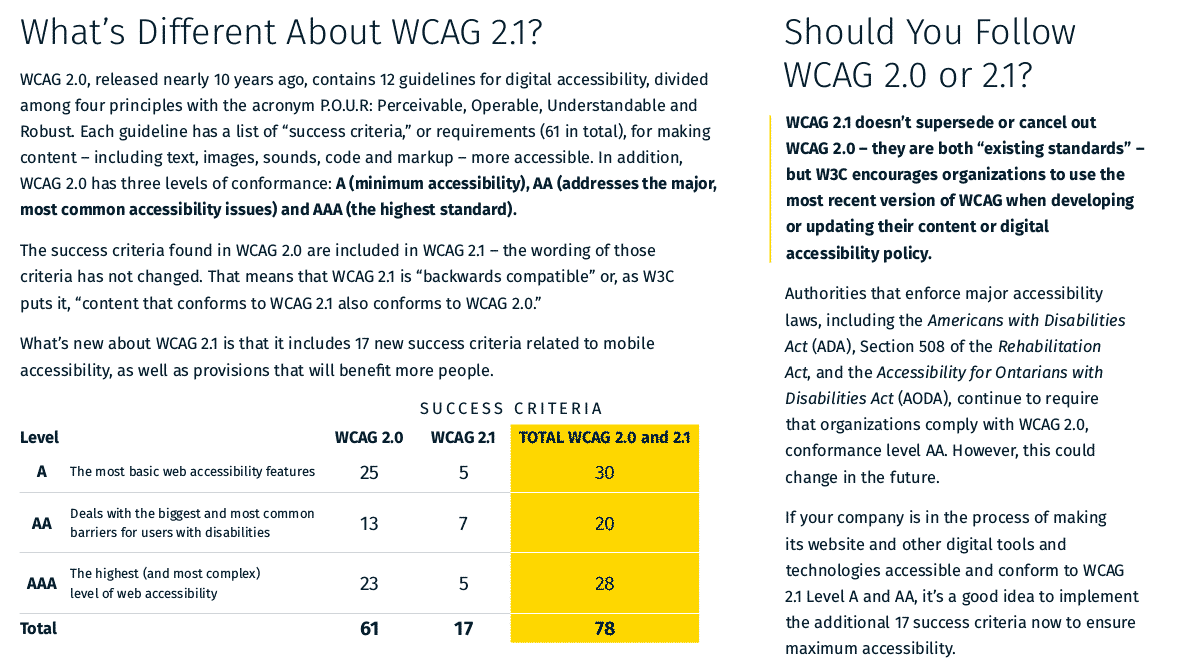
What’s Different About WCAG 2.1?
WCAG 2.0, released nearly 10 years ago, contains 12 guidelines for digital accessibility, divided among four principles with the acronym P.O.U.R: Perceivable, Operable, Understandable and Robust. Each guideline has a list of “success criteria,” or requirements (61 in total), for making content – including text, images, sounds, code and markup – more accessible. In addition, WCAG 2.0 has three levels of conformance: A (minimum accessibility), AA (addresses the major, most common accessibility issues) and AAA (the highest standard).
WCAG 2.1 Level A Checklist
Success Criteria Description
1.1.1 – Non-text Content Provide text alternatives for non-text content
1.2.1 – Audio-only and Video-only
(Pre-recorded) Provide an alternative to video-only and audio-only content
1.2.2 –Captions (Pre-recorded) Provide captions for videos with audio
1.2.3 – Audio description or Media Alternative (Pre-recorded) Video with an audio has a second alternative
1.3.1 – Info and Relationships Logical structures
1.3.2 – Meaningful Sequence Present content in a meaningful order
1.3.3 – Sensory Characteristics Use more than one sense for instructions
1.4.1 – Use of Colour Don’t use presentation that relies solely on colour
1.4.2 – Audio Control Don’t play audio automatically
2.1.1 – Keyboard Accessible by keyboard only
2.1.2 – No Keyboard Trap Don’t trap keyboard users
2.1.4 – Character Key Shortcuts Do not use single key shortcuts or provide a way to turn them off or change them
2.2.1 – Timing Adjustable Time limits have user controls
2.2.2 – Pause, Stop, Hide Provide user controls for moving content
2.3.1 – Three Flashes or Below No content flashes more than three times per second
2.4.1 – Bypass Blocks Provide a “Skip to Content” link
2.4.2 – Page Titled Helpful and clear page title
2.4.3 – Focus Order Logical Order
2.4.4 – Link Purpose (In Context) Every link’s purpose is clear from its context
2.5.1 – Pointer Gestures Users can perform touch functions with assistive technology or one finger
2.5.2 – Pointer Cancellation This requirement applies to web content that interprets pointer actions
2.5.3 – Label in Name The name contains the text that is presented visually
2.5.4 – Motion Actuation Functions that are trigged by moving a device or by gesturing towards a device can also be operated by more conventional user interface components
3.1.1 – Language of Page Page has a language assigned
3.2.1 – On Focus Elements do not change when they receive focus
3.2.2 – On Input Elements do not change when they receive input
3.3.1 – Error Identification Clearly identify input errors
3.3.2 – Labels or Instructions Label elements and give instructions
4.1.1 – Parsing No major code errors
4.1.2 – Name, Role, Value Build all elements for accessibility
WCAG 2.1 Level AA
1.2.4 – Captions (Live) Live videos have captions
1.2.5 – Audio Description (Pre-recorded) Users have access to audio description for video content
1.3.4 – Orientation Requires authors not to rely on a screen orientation
1.3.5 – Identify Input Purpose Ensure common names are provided using the HTML autocomplete list
1.4.3 – Contrast (Minimum) Contrast ratio between text and background is at least 4.5:1
1.4.4 – Resize Text Text can be resized to 200% without loss of content or function
1.4.5 – Images of Text Don’t use images of text
1.4.10 – Reflow Your website must be responsive
1.4.11 – Non-Text Contrast High contrast between pieces of text and their backgrounds
1.4.12 – Text Spacing Text spacing can be overridden to improve the reading experience
1.4.13 – Content on Hover Focus Ensuring content visible on hover or keyboard focus does not lead to accessibility issues
2.4.5 – Multiple Ways Offer several ways to find pages
2.4.6 – Headings and Labels Use clear headings and labels
2.4.7 – Focus Visible Keyboard focus is visible and clear
3.1.2 – Language of Parts Tell users when the language on a page changes
3.2.3 – Consistent Navigation Use menus consistently
3.2.4 – Consistent Identification Use icons and buttons consistently
3.3.3 – Error Suggestion Suggest fixes when users make errors
3.3.4 – Error Prevention (Legal, Financial, Data) Reduce the risk of input errors for sensitive data
4.1.3 – Status Changes Distances between paragraphs, rows, words and characters must be able to be increased to
a certain value
Here is a concise, one-page WCAG 2.2 AA checklist for developers, focusing on practical implementation steps and covering both continuing AA requirements and new 2.2 additions.








We have seen fewer opportunities in the SLED sector in 2025 and we track RFPs on weekly basis. We’ve included some charts below.
Commentary is from Tay Taehoon Kim who is Practice Leader, Head of ProAV research at Omdia. They do well-respected research.
LinkedIn Post — LCD/OLED/EPD Public display shipments in China and Western Europe boost 3Q global performance to 5.7% QoQ, despite dip in North America and Asia & Oceania. Each region has a unique set of strengths and challenges.
North America still contends with high interest rates, reporting a dip in public display shipments. Weakness in IFP/touch display shipments for North America continues to be evident in 3Q25 mainly due to weaker demand in the lower education market in the US than initially anticipated. Many K-12 school districts were impacted by reduced federal funding or are waiting to upgrade their displays in 2026 or later.
Third quarter public display results also reaffirm that, amid tariff implications in the US market, Chinese display vendors continue to focus sales efforts on other regions, such as Western Europe and the Middle East & Africa.
Despite an increase of QoQ for 3Q25, the lift in China’s public display market was mostly due to seasonality. Weakened demand in traditional education and classroom displays resulted YoY negative growth. Some of the shipments for IFP/touch displays were driven by AI+ functions through government policies, but budget issues remain. Additionally, corporate and conference room verticals are also limited by operation cost control from enterprises, with a shift in preference to signage and information display or signage TV products at a lower cost compared with IFP/touch displays.
Please check more detail from Kelly Lum‘s analyst opinion column (https://lnkd.in/gN9jWSNP).